If the valuation gaps we see today are to return to something more akin to ‘normal’ in the context of long-term history, the value recovery that began at the end of last year still has a long way to go.
Could value stocks really benefit from the prospect of higher inflation? After the decade value investors have had, you might imagine they - we - would be grateful for any and every market commentator with a supportive word for the discipline but we are nothing if not contrarians. And so, to the growing number of people suggesting value stocks stand to benefit from higher inflation, we ask again - really?
Investing is comparable to applied history, so let’s take a step back and start with the big picture. Any debate around inflation and what it might mean for equities has to be viewed within the context of asset markets that, for the past 10 years or so, have been dominated by declining inflation, falling interest rates and the quantitative easing (QE) policies of governments and central banks.
Courtesy of data from Société Générale encapsulated in the following two charts, we can see that – even with levels of inflation that have been below 2% for pretty much the whole of the last 10 years – the real yield on a traditional global balanced portfolio is already negative. This in turn means markets are particularly vulnerable to higher inflation today.

Source: Société Générale, data to May 2020
If we then split the global equity market into valuation quintiles based on the five-year trailing correlation to US bonds, we can see that - with the onset of QE - a gap begins to open up around 2010/11. Put simply, this gap is between stocks that benefitted from the lower discount rate (quality and growth) and stocks that suffered (cyclicals, financials and value).
You can read more about the discount rate in How interest rates affect stockmarkets, but what these numbers reveal is the reason valuations have become so extreme is actually in part down to ultra-low bond yields. It follows, then, that investors seeking quality or growth in the equity market have significantly re-rated these stocks - and that now leaves them very vulnerable to higher yields.
For the past few years, weak inflation, disappointing GDP growth and falling bond yields occasioned by QE have benefited growth/quality assets, while penalising the more economically-exposed cyclical ones - which, at this point in the cycle, make up much of the value universe. This has pushed relative valuations to never-before-seen extremes.
The green line in the above-right chart is now at risk as it is both very expensive and very negatively sensitive to rising bond yields. On the other hand, the blue line is cheap - and, since that is due to the macroeconomic regime of the last decade, it stands to benefit most from that reversing. This explains how we got here, then, but what can a longer-term history from multiple markets tell us about inflation and equity market returns?
Valuation not inflation
We will now turn to some data from Citi, whose analysts have been collating inflation and equity market data since the 1950s. As the next pair of charts show, there is indeed a relationship between inflation and equity market returns - broadly speaking, equities have been a decent inflation hedge. This makes sense as they are a real asset class, where corporate revenues offer positive exposure to rising consumer prices.
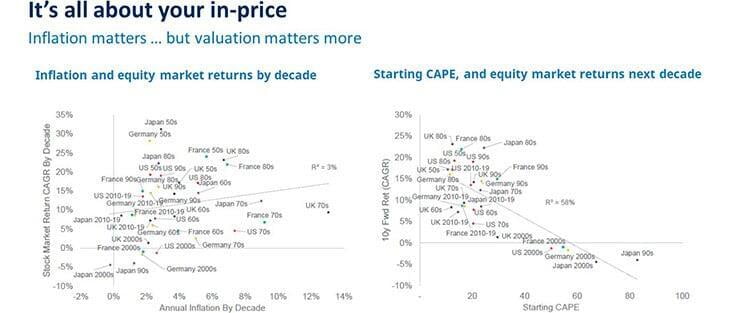
Source: Citi Research, Global Financial Data, MSCI, 07/06/21
Even so, the relationship between inflation and equity market returns is not one you would necessarily hang your hat on. Equity markets struggled in the 1970s when inflation was on the rampage, for example – and they performed poorly in Japan in the 1990s, and in the US in the 2000s, even though both periods saw falling inflation and interest rates.
If inflation is not a reliable guide, though, where does that leave us? The above-right chart plots subsequent decade returns against those markets’ starting cyclically-adjusted price-to-earnings ratios or ‘CAPEs’. If we look for those same poorly performing periods for Japan in the 1990s and the US in the 2000s, we can see the former’s starting valuation was a CAPE of 80x while the latter’s was a CAPE of 50x.
The conclusion here is there is a much better predictor of longer-term equity performance than inflation, and it is starting valuation. So, while it is true inflation matters to an extent - and it is likely modest inflation would benefit many of the cyclical companies to which value investors are exposed today - valuation matters much more. Ultimately, whatever the level of inflation, you see the equity return you pay for.
Valuation dispersion
Still, even if you do see the return you pay for, it would be quite reasonable to point out that, in aggregate, equities are pretty expensive. Most notably, the US, which in total accounts for two-thirds of the global market benchmark, is as expensive as it has ever been on a variety of valuation metrics. And, as we just pointed out, exceptionally high valuations can only indicate exceptionally low returns over the longer term.
If what you pay matters and equities are expensive, then how, here on The Value Perspective, can we be so excited about prospective returns for investors from today? It is because, as our final chart illustrates, valuation dispersion within the market - that is, the gap in fundamental valuation between the most and the least highly rated shares - remains at extreme levels.
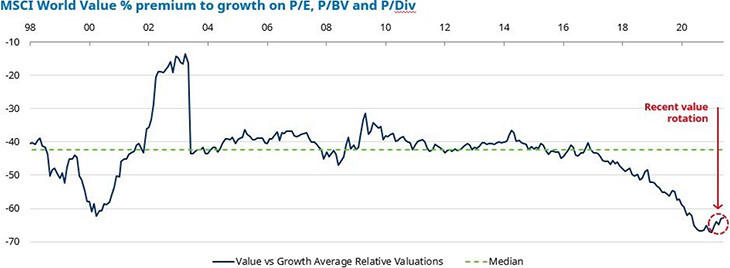
Source: Morgan Stanley, data from 31 January 1998 to 8 June 2021
Indeed, on a global basis, the gap is more extreme than at the dotcom peak in 2000. Valuation dispersions mean, even if overall market returns prove to be paltry, returns from the most undervalued parts of the market can be stellar over the coming years. And if the valuation gaps we see today are to return to something more akin to ‘normal’ in the context of long-term history, the value recovery circled in red has a long way to go.
To read our latest value insights, click here or visit our website to find out how Schroders can support you

By Andrew Williams
By Andrew Williams